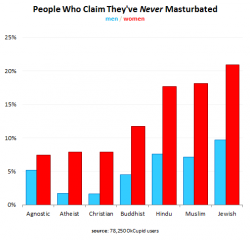
 Research and infographic powerhouse OkCupid has a new story that looks into, you guessed it, sex.
Some of the graphics are interactive, featuring sliders, clickable menus and zoomable datasets.
Relationship duration, sexual proclivities and of course a perennial favorite, per capital GDP vs. portion of people looking for casual sex.
I was especially pleased to see them use a graphics from Edward R Tufte’s amazing book The Visual Display of Quantitative Information. Major props for referencing one of the kings of information visualization.
Read 10 Charts About Sex for the full skinny on this months look at OkCupid users. All of the data is from real user activity on OkCupid.

